Current Market Data

Midwestern and southern metros may dominate buyer interest in 2026, according to the National Association of REALTORS®.
Geographically, trends varied widely, with formerly hot areas like Florida and the Southeast posting the deepest declines and formerly cool areas, like the Midwest, showing healthy gains.

Spa-style amenities, customizable lighting options, integrated technology, storage solutions — and ample space for these features — all surfaced as top trends.

By region, sales rose in the Midwest, Northeast and South but fell in the West.
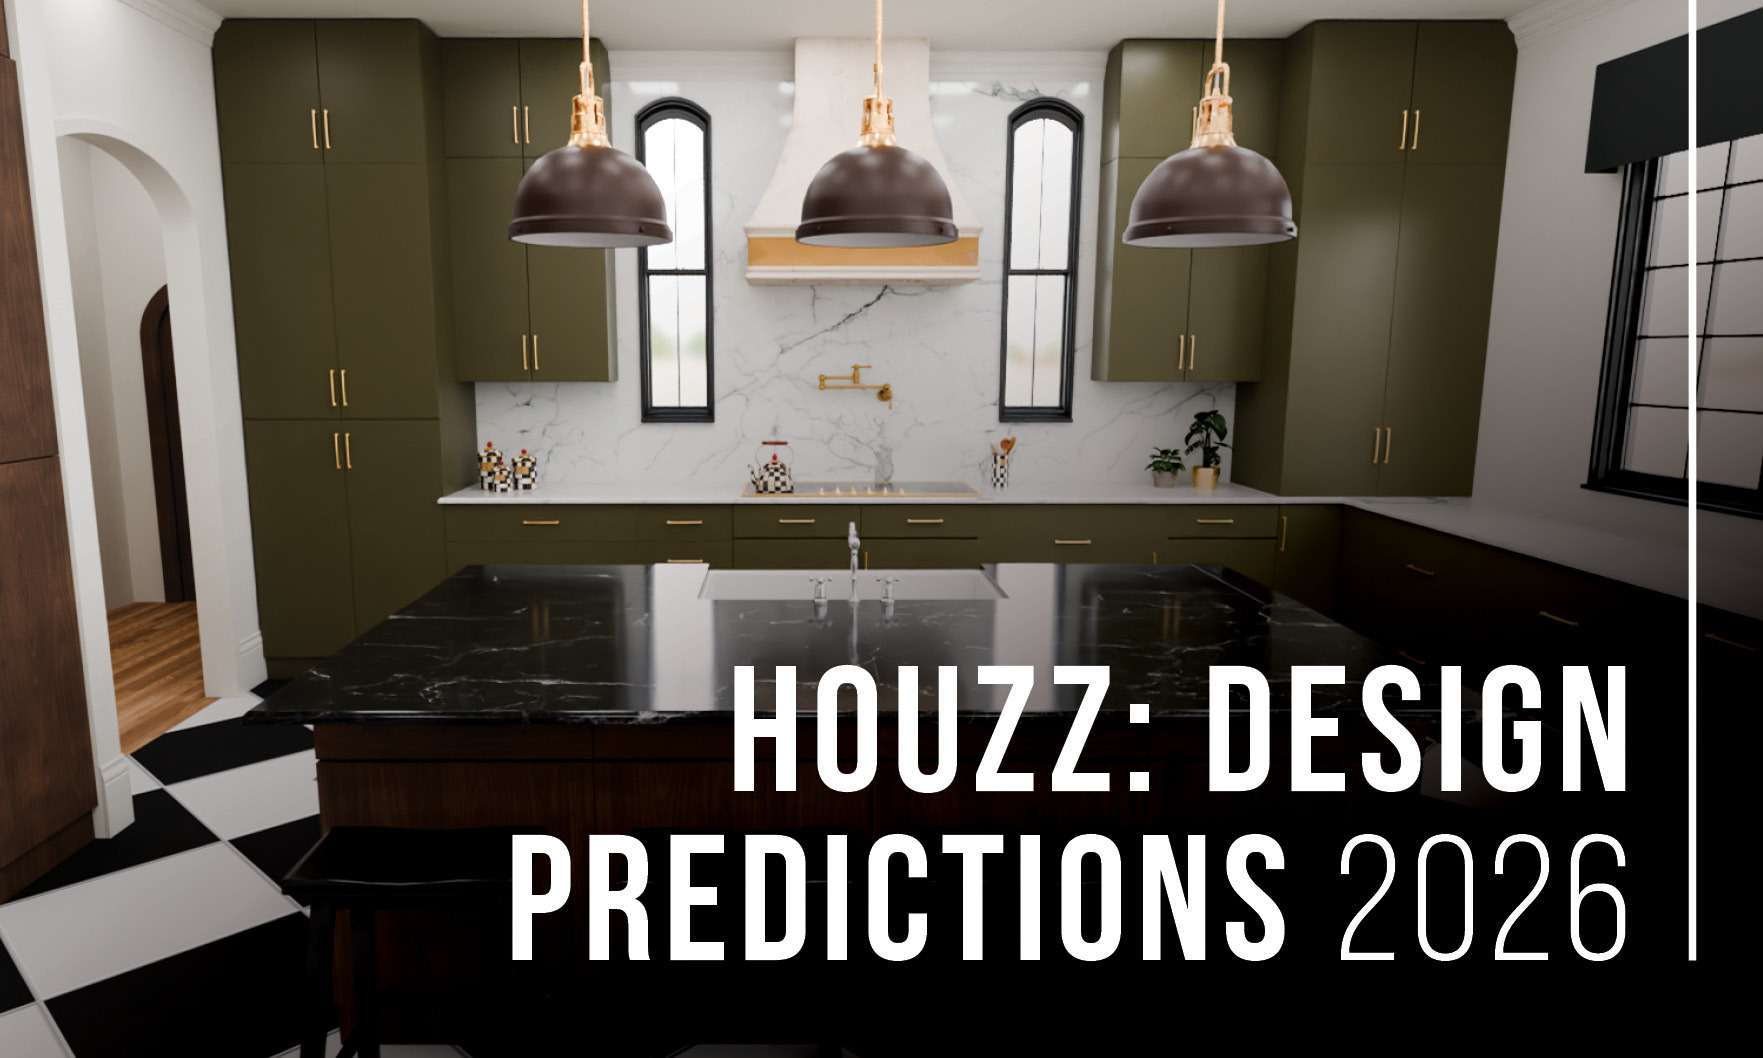
Bold, geometric designs like chevrons, sunbursts, zigzags and stepped shapes are making a huge comeback as of late — and Houzz said that will continue into 2026.
The chief economist for the National Association of REALTORS® also predicts home prices will climb 4% compared to 2025.

At the top of the list? WaterSense fixtures — the plumbing solution, which claims to reduce water use by more than 20%, increased in popularity by 289.6%.

At the same time, the average age of the first-time buyer hit an all-time high of 40, according to the 2025 Profile of Home Buyers and Sellers.
Nationwide, the median price for a single-family home increased 1.7% year over year to $426,800. Prices increased by the same annual rate during the second quarter.

How will the government shutdown hit the real estate market? Will big company mergers change the industry landscape? Economist Matthew Gardner is back answering those questions and more in his Q3 2025 Update with Agent Publishing Co-Founder Anne Hartnett.
Given the rate of sales, the nation had a 4.6-month housing supply, up from 4.2 months a year prior.

Tapping into Realtor intel, Zillow analyzed its listing database for keywords that are increasing most in popularity heading into the new year.

Agent Publishing Founder and Publisher Anne Hartnett discusses Brokerage Culture with Realogics Sotheby’s International Realty’s Val Burmester, Rachel Schindler and Dean Jones.
The pace of home sales, meanwhile, remained at “multi-decade lows” even as affordability reached its most favorable level since 2022.
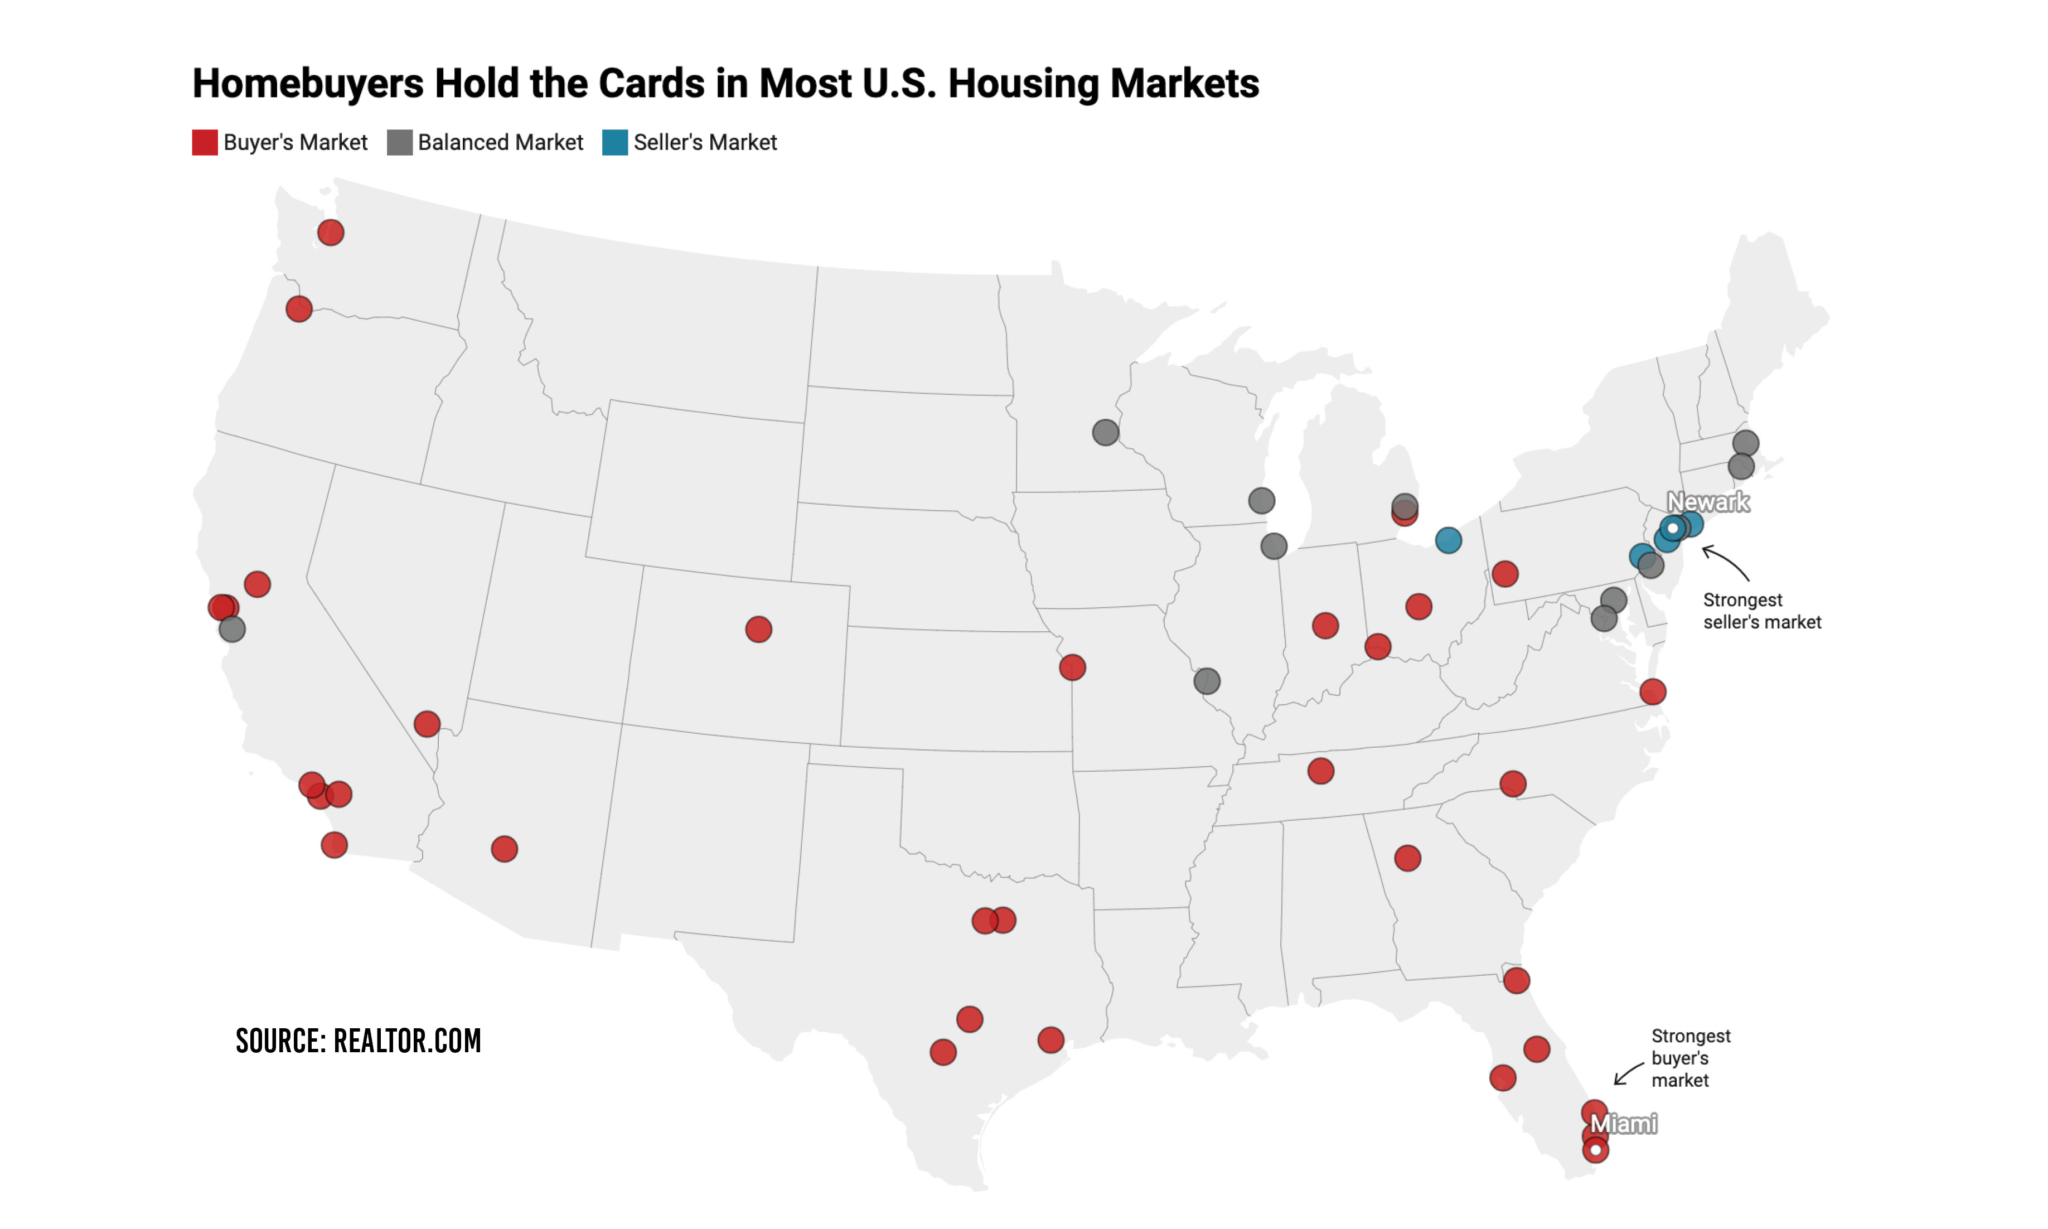
Across reports from Realtor.com, Zillow and Redfin, the data converges on one clear truth: the housing market’s momentum is tilting toward those shopping for homes rather than those selling them.
The pace of home-price appreciation declined to its weakest pace in 10 years, according to the S&P Cotality Case-Shiller U.S. National Home Price Index.